Relatório Trimestral

Carmignac P. EM Debt: Letter from the Fund Manager
-
+9.08%Carmignac P. EM Debt’s performance
in the 4th quarter of 2022 for the FW EUR Share class
-
+0.45%Reference indicator’s performance
in the 4th quarter of 2022 for JP Morgan GBI – Emerging Markets Global Diversified Composite Unhedged EUR Index
-
+8.63%Of outperformance
versus the reference indicator over the period
Carmignac P. EM Debt gained +9.08% in the fourth quarter of 2022, while its reference indicator¹ was up +0.45%.
Quarterly Performance Review
The last quarter of 2022 was driven by a recovered confidence in risk following a stabilization of the rates markets. This was driven partly by falling inflation and partly by expectations of an upcoming recession. The US Dollar consequently started to give back its stellar performance of the year.
Other headwinds to EM assets and risk in general have also started to turn. First the Federal reserve started signaling a shift in the speed of tightening given the inflation and growth prospect. China which had stuck to a strict zero covid policy is rushing to abandon that policy and pushing through a stimulus in its property sector. And finally, the war in Ukraine which had created a big shock in food and energy prices has started becoming more localized in eastern Ukraine and the world has adapted to the new reality in terms of commodities supply.
Market wise External debt rallied over 100bps and local debt yields rallied around 50bps while FX was more mixed, certainly rallying vs. USD but not necessarily vs. EUR which was one of the strong currencies in Q4.
In the year we have seen exceptionally negative returns in the EM universe with the EMBIGD benchmark returning -17.8% over 2022 exceeding the previous annual low of 2008 at -12.0%.
EMBIG Index (sovereign external debt index)
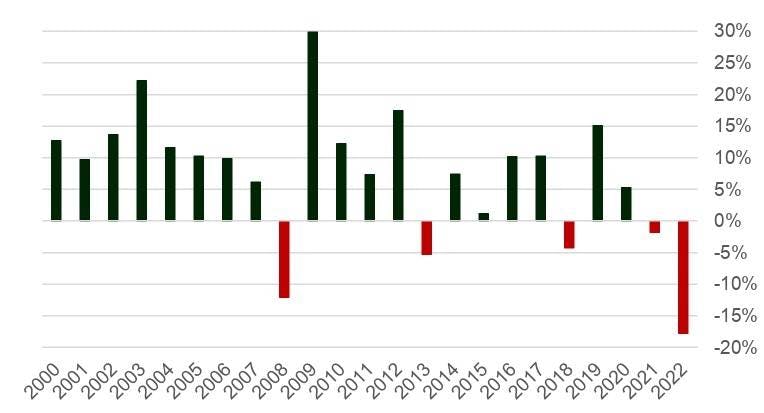
Source: Carmignac, Bloomberg, 30/12/2022
While the GBI-EM (Local Rates) returned the second worse year since the existence of the index at -11.5% vs -14.9% in 2015.
GBI EM EUR Index (sovereign local debt index) - Annual Returns
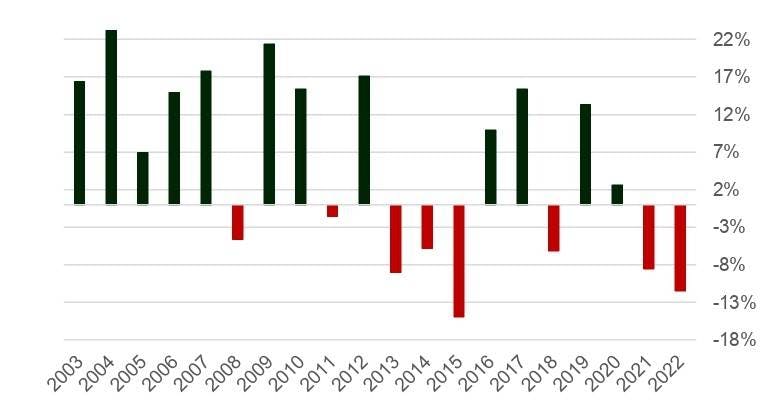
Source: Carmignac, Bloomberg, 30/12/2022
What have we done in this context
Following the rally in the credit bonds we have reduced the fund’s exposure to high beta names selling for instance: Angola, Tunisia, Egypt and the Dominican Republic. Meanwhile we increased our allocation of front-end IG credits such as Romania, or Poland Quasi-Sovereigns. We continued to actively manage the overall credit risk via CDS.
In local rates we have reinforced very significantly our long exposure to Brazilian rates following the sell-off in mid-November. We have also continued to be long Hungarian rates which saw a rally following the resolution on the EU funds. More broadly as the global rates environment relaxed from mid-November we added some long rates in Mexico, and Korea while we reduced outperformers such as the Czech and Chilean Rates.
In FX the environment was not as conductive for EM to perform, over the month we retained a large exposure to the CZK thanks to its high carry as well as the credible anchoring of the currency by the central bank, while being highly correlated to EUR.
Outlook for the next months
Looking ahead we expect the main headwinds for EM fixed income to start slowly fading away. First, inflation is expected to keep edging down pushing eventually in Q1 the Federal reserve to pause its rate hiking cycle. China has clearly moved away from zero covid policy and has been injecting stimulus in its property sector which tends to be a key sector for EM globally. And finally, the world is adjusting to the energy and food chock which resulted from the war in Ukraine and will keep adjusting further as we’re seeing all across Europe with the LNG terminals and the renewable push.
In that context we will be favouring duration again, mainly in local currency as well as credit in laggards such as central European names. We think that the early hikers remain interesting and in particular Brazil, however some late comers to the hiking cycle are also interesting such as Mexico.
FX is where we see the least upside against the EUR, but we expect the dollar to stay on a downward trend from here.
Sources: Carmignac, Bloomberg, 30/12/2022
Carmignac Portfolio EM Debt FW EUR Acc
Horizonte de investimento mínimo recomendado
Risco mais baixo Risco mais elevado
. .
PAÍSES EMERGENTES: As condições de funcionamento e de supervisão dos mercados "emergentes" podem desviar-se das normas em vigor nas principais praças mundiais e ter implicações nas cotações dos instrumentos cotados nos quais o Fundo pode investir.
TAXA DE JURO: O risco de taxa de juro resulta na diminuição do valor patrimonial líquido no caso de variações nas taxas de juro.
CRÉDITO: O risco de crédito consiste no risco de incumprimento do emitente.
CAMBIAL: O risco cambial está associado à exposição a uma moeda que não seja a moeda de avaliação do Fundo, através de investimento direto ou do recurso a instrumentos financeiros a prazo.
Este fundo não possui capital garantido.
Carmignac Portfolio EM Debt FW EUR Acc
| 2014 | 2015 | 2016 | 2017 | 2018 | 2019 | 2020 | 2021 | 2022 | 2023 |
2024 (YTD) ? Desde o início do ano até à data |
|
|---|---|---|---|---|---|---|---|---|---|---|---|
| Carmignac Portfolio EM Debt FW EUR Acc | - | - | - | +1.10 % | -9.97 % | +28.88 % | +10.54 % | +3.93 % | -9.05 % | +15.26 % | +1.42 % |
| Indicador de Referência | - | - | - | +0.42 % | -1.48 % | +15.56 % | -5.79 % | -1.82 % | -5.90 % | +8.89 % | +0.88 % |
Deslocar para a direita para ver a tabela completa
| 3 anos | 5 anos | 10 anos | |
|---|---|---|---|
| Carmignac Portfolio EM Debt FW EUR Acc | +3.50 % | +8.03 % | - |
| Indicador de Referência | +1.47 % | +1.07 % | - |
Deslocar para a direita para ver a tabela completa
Fonte: Carmignac em 28/03/2024
| Custos de entrada : | Não cobramos uma comissão de subscrição. |
| Custos de saída : | Não cobramos uma comissão de saída para este produto. |
| Comissões de gestão e outros custos administrativos ou operacionais : | 1,05% O impacto dos custos que suportamos anualmente pela gestão dos seus investimentos e outras comissões administrativas. Esta é uma estimativa baseada nos custos efetivos ao longo do último ano. |
| Comissões de rendimento : | Não existe comissão de desempenho para este produto. |
| Custos de transação : | 0,57% O impacto dos custos inerentes às nossas operações de compra e de venda de investimentos subjacentes ao produto. |